Debugging Inside Eclipse
The easiest way to debug your Java web application is to create a Server in the Eclipse Servers view and start the Server in Debug mode. For this article, We will use Tomcat 7 as our Server.
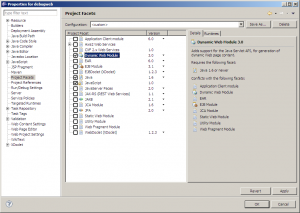
Your web application must be assigned the Dynamic Web Module Project Facet for this to work. If you didn’t create this web application using the Eclipse New Project Wizard, you will have to assign this Project Facet in Project Properties.
Place breakpoints and start stepping through code.
Remote Debugging
If you cannot run your server inside Eclipse, try remote debugging. First, start the Server in debug mode. To run Tomcat in debug mode, run the following command.
tomcat-bin>catalina jpda start
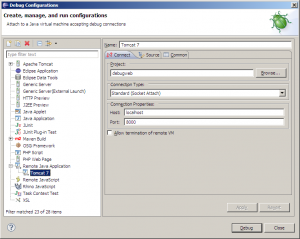
Then go to Run -> Debug Configurations… and create a new Remote Java Application.
The default debug port for both Tomcat and Eclipse is 8000, so we just accept the defaults. Click the Debug button to start the remote debugging process.
Maven Debugging
If you run your Server from within Maven, then we have to run Maven in debug mode.
webapp-home>mvnDebug tomcat:run
This starts Maven, and Tomcat, in debug mode. Now that Tomcat is running, follow the same steps as remote debugging Tomcat from Eclipse. Note that mvnDebug uses -Xrunjdwp:suspend=y, so Maven is suspended until Eclipse connects to it.


